Predictive Maintenance and Round Robin Testing: Navigating Sensor Measurement Uncertainty in Industrial Environments

Modern industrial operations demand predictive maintenance strategies backed by robust quality assurance. Yet many organizations struggle with a critical challenge: measurement uncertainty in sensor systems undermines the very foundation of reliable condition monitoring and accurate failure prediction. Round robin testing offers a proven framework to evaluate and improve sensor performance across different environments, and QuoData specializes in implementing these solutions.
The Hidden Cost of Sensor Measurement Uncertainty
Predictive maintenance promises to prevent failures before they occur, but this promise hinges on sensor accuracy. Measurement uncertainty—the doubt about a measured quantity's true value—becomes critical when combining data from multiple sources or analyzing historical trends.
Industrial sensors battle constant challenges: temperature variations, vibration, electromagnetic interference, and aging components. These uncertainties don't just create noise, they lead to false alarms, missed failures, and incorrect maintenance scheduling that costs millions in downtime.
Round Robin Testing: Your Framework for Confidence
Round robin testing transforms how we understand sensor performance variability. By comparing measurements across different teams, algorithms, or time periods using identical datasets, this approach delivers three critical capabilities:
- Performance Benchmarking: Evaluate different predictive maintenance algorithms using baseline data to determine relative accuracy. QuoData's fit-for-purpose testing protocols ensure apples-to-apples comparisons that drive informed technology decisions.
- Uncertainty Quantification: Compare results across multiple systems to quantify overall measurement uncertainty, crucial for setting appropriate alarm thresholds. Our expertise helps establish uncertainty intervals that balance sensitivity with false alarm reduction.
- Method Validation: Validate new sensor technologies against established references before full deployment. QuoData's validation frameworks have helped clients avoid costly implementation mistakes.
The uncertainty comparison in the figure below reveals why round robin approaches are essential: different sensors (S1 and S2) show dramatically varying performance across measured features (A-H). Some features maintain uncertainty below 5%, while others exceed 10%—critical intelligence for maintenance decisions.

Sensor Types and Measurement Characteristics
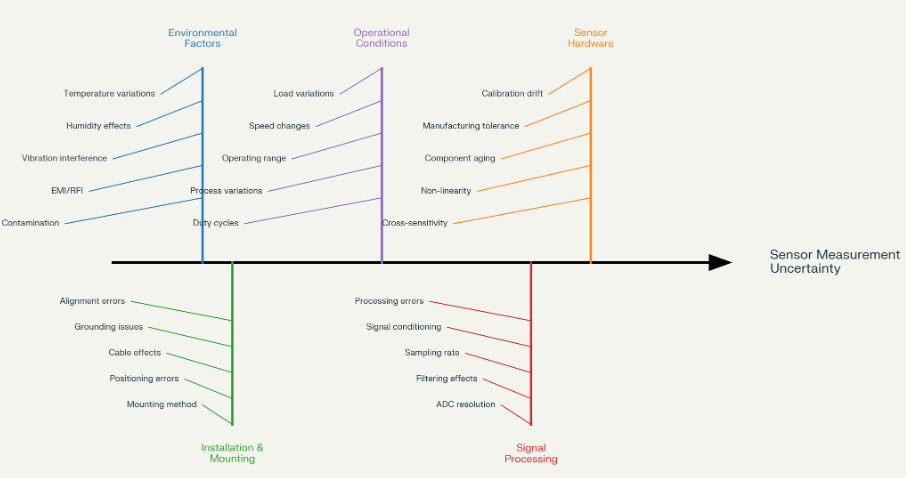
Factors Contributing to Measurement Uncertainty on the Shop Floor
Individual sensors achieve uncertainties below 5% in controlled conditions. On the shop floor? Performance degrades significantly due to interconnected factors:
- Environmental: Temperature, humidity, vibration, EMI
- Installation: Mounting stiffness, positioning, grounding
- Hardware: Calibration drift, component aging, non-linearity
- Signal Processing: ADC limitations, filtering effects, sampling constraints
- Operational: Load variations, speed changes, process variations
QuoData's assessment services identify and mitigate these uncertainty sources before they compromise your predictive maintenance program.

When measurement uncertainty grows large, subtle fault signatures disappear into noise—destroying predictive power and creating both missed failures and false alarms.
Signal Morphology: The Key to Early Detection
True predictive maintenance extends beyond threshold monitoring to analyze how signal patterns evolve from healthy to degraded states. Signal morphology analysis provides robust fault detection even when measurement uncertainty might mask absolute changes.
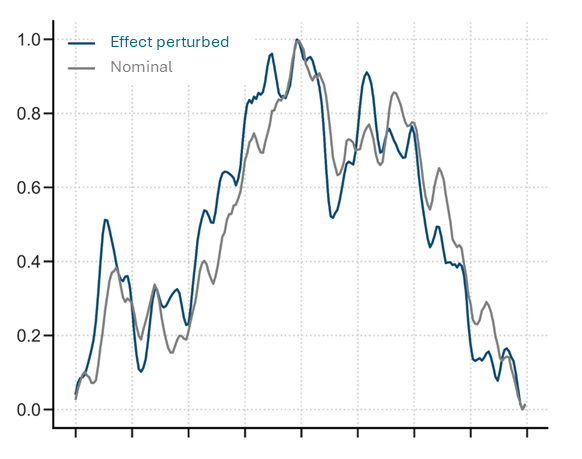
The comparison between nominal (gray) and effect-perturbed (blue) signals shows how morphological changes indicate developing problems:
- Amplitude Modulation: Variations indicating bearing wear, imbalance, or looseness
- Frequency Evolution: New components appearing as faults develop
- Pattern Irregularity: Loss of mechanical stability preceding failure
- Temporal Correlation: Systematic differences enabling failure forecasting
QuoData's advanced analytics leverage these morphological signatures to detect problems weeks before traditional threshold systems, even in high-uncertainty environments.

Transform Your Predictive Maintenance with QuoData
Measurement uncertainty isn't just a technical specification, it's a business-critical factor affecting every maintenance decision. QuoData brings specialized expertise to help you:
Immediate Impact Services:
- Uncertainty Audits: Quantify current sensor performance gaps and prioritize improvements
- Round Robin Implementation: Design and execute testing protocols for your specific equipment
- Algorithm Validation: Ensure your predictive models account for real-world uncertainty
Long-term Partnership Benefits:
- Custom uncertainty models for your unique operational environment
- Training programs to build internal expertise
- Continuous improvement frameworks that evolve with your needs
- Integration support for uncertainty-aware analytics and ML systems
Don't let measurement uncertainty undermine your predictive maintenance investment. Our proven methodologies have helped industrial clients reduce false alarms by 40%, extend equipment life by 25%, and cut maintenance costs by millions.
Ready to maximize your predictive maintenance ROI? Contact QuoData's expert team for a complementary uncertainty assessment. Discover how proper uncertainty management transforms maintenance from reactive firefighting to proactive optimization.
